
Best Cars for Turo in 2026: Ranked by Profit, Not Bookings
The most booked cars on Turo are not the most profitable. Here is how to rank a vehicle by what it actually nets after fees, maintenance and depreciation.
 By The FleetSnap Team·9 min read
In this guide
- Why the most booked car is rarely the most profitable
- The four numbers that decide a vehicle
- Where the depreciation figures below come from
- Best cars under $20,000
- Best cars $20,000 to $40,000
- Luxury and exotic: when the math works
- Cars to avoid, and why
- How to run the numbers on any car before you buy
- How to know which of your cars is actually earning
- Questions hosts ask
Search this term and you get the same article fifteen times: a list of popular cars, ranked by how often they book, with a photo of each.
It is the wrong ranking. Booking frequency tells you about demand. It tells you nothing about whether the car makes you money, and those two things diverge more than most people expect.
Here is the version ranked by what you actually keep.
Why the most booked car is rarely the most profitable
The cars that book constantly tend to share a profile. They are newer, they are desirable, and they photograph well. All three of those things also mean they lose value quickly.
A vehicle that books twenty-two days a month at a strong daily rate can easily lose more in depreciation over a year than a less glamorous car earns in total. The booking calendar looks magnificent. The balance sheet does not.
The second divergence is maintenance. High-demand vehicles get driven hard, and the cars people most want to rent are frequently the ones with the most expensive consumables. A set of tires on a performance vehicle can wipe out a month of profit.
The third is the one almost nobody models: downtime. A car in the shop is not just not earning, it is still costing you the finance payment, the insurance and the depreciation. Parts availability matters more to profitability than engine output does.
So the ranking that matters is not "what books" but "what nets, after everything, including the value the car quietly loses while sitting in your driveway."
The four numbers that decide a vehicle
Before you look at any specific model, these are the inputs. If you cannot fill them in for a car you are considering, you are not ready to buy it.
Acquisition cost, all in. Purchase price, taxes, fees, any immediate work needed, and the cost of money if you are financing. A $20,000 car financed at a high rate is not a $20,000 car.
Realistic utilization for your market. Not the best month, the average. Most operators overestimate this by a wide margin when modeling, and it is the single biggest source of error in first-car projections.
Annual depreciation. What the car will be worth in twelve months against what you paid. This is the number nobody subtracts and it is frequently the largest single cost of owning a rental vehicle.
Running cost per rented day. Maintenance, tires, cleaning, and a realistic allowance for damage that does not get recovered.
Net profit is daily rate times utilized days, minus platform fees, minus running costs, minus finance, minus depreciation. Anything that skips the last term is not a profit calculation.
You can run this on any vehicle with the free earnings tool before you commit.
Where the depreciation figures below come from
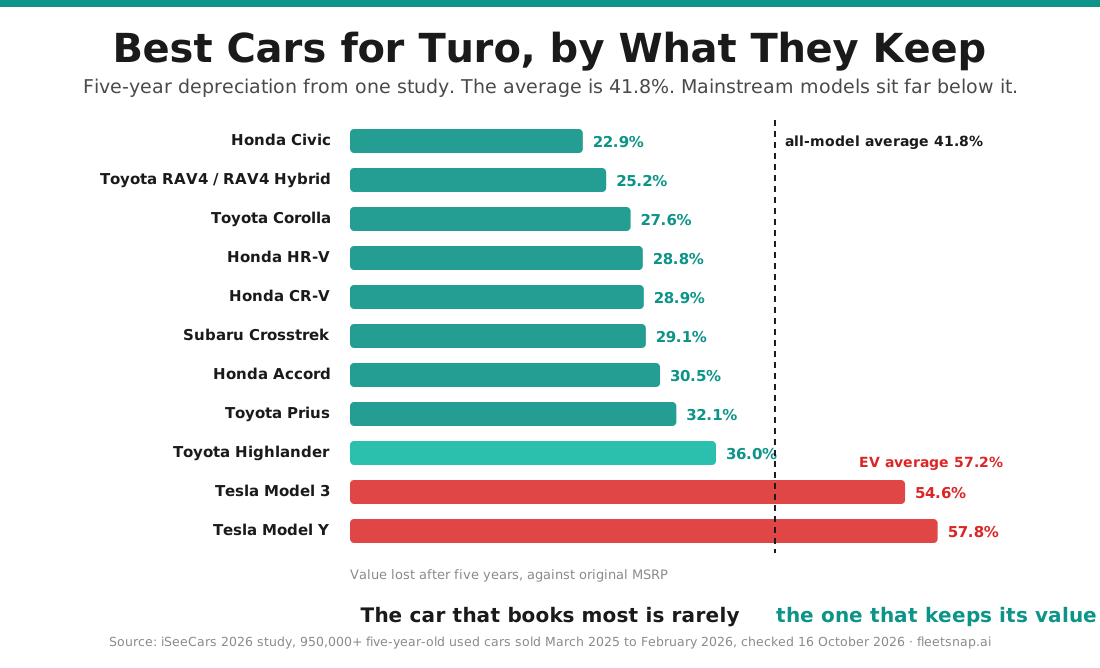
The model examples in this guide use one source so they compare like with like: iSeeCars' 2026 depreciation study, which analyzed over 950,000 five-year-old used cars sold from March 2025 to February 2026 and measured how far each model's price had fallen from its original MSRP. The average across all models was 41.8%. Checked 16 October 2026.
Two cautions before you use them. A five-year figure measures the loss the first owner took, not the loss you will take from here, so treat it as a signal of how hard the used market keeps paying for a model rather than a forecast for your car. And the figures are national averages, so the price you pay in your metro, the trim and the mileage all move the result. The examples are illustrative, not a buying list.
Reliability notes come from J.D. Power's Vehicle Dependability Study, which surveys original owners of three-year-old vehicles, as reported in the manufacturers' own announcements of their awards.
Best cars under $20,000
This band is where the math works most reliably, because depreciation has already done most of its damage to the vehicle before you bought it.
What to look for: three to six years old, mainstream brand, widely available parts, strong reliability record, moderate insurance cost. Economy and compact sedans, small crossovers, and reliable mid-size sedans.
What the band gives you is a low depreciation rate as a percentage of purchase price and cheap repairs when things go wrong. What it costs you is a lower daily rate and a less exciting listing.
The counterintuitive result, which operators consistently report once they start measuring properly, is that these vehicles frequently out-earn more expensive ones on net profit despite much lower gross revenue.
Models worth modeling here, if local prices put a three to six year old example inside the band:
| Model | 5-year depreciation | Reliability note |
|---|---|---|
| Honda Civic | 22.9% | Lowest-depreciating mainstream sedan in the study |
| Toyota Corolla | 27.6% | Compact Car award, J.D. Power 2024 VDS (2021 model-year vehicles) |
| Honda HR-V | 28.8% | Second-lowest small SUV in the study |
| Subaru Crosstrek | 29.1% | Most Dependable Small SUV, J.D. Power 2026 VDS |
| Toyota Prius | 32.1% | Hybrid; the hybrid segment averaged 35.4% |
Read the table the right way round. None of these is "the best car for Turo." They are the models where the depreciation term in your calculation is smallest, which is the term most first-time buyers leave out. Whether one of them wins in your market still depends on what it rents for there and what you can buy it for.
Sources: depreciation from iSeeCars, "Cars That Hold Their Value" 2026 study. Crosstrek award from Subaru of America's announcement of 17 February 2026. Corolla award from Toyota's announcement of 8 February 2024 covering the 2024 study, which surveyed owners of 2021 model-year vehicles. All checked 16 October 2026.
Best cars $20,000 to $40,000
The middle band is where most fleets concentrate, and where the decision gets genuinely harder because the trade-offs are real in both directions.
Newer mid-size and full-size SUVs, premium-badge compacts, and electric vehicles all live here. The daily rates are meaningfully better. So is the depreciation, in the wrong direction.
Here is how the spread looks inside one study. The mainstream SUVs and sedans that hold value best sit far below the average. The electric and premium models that book well sit far above it.
| Model | 5-year depreciation | Note |
|---|---|---|
| Toyota RAV4 / RAV4 Hybrid | 25.2% | Lowest of any small SUV in the study |
| Honda CR-V | 28.9% | Small SUV average was 41.7% |
| Honda Accord | 30.5% | Midsize sedan |
| Toyota Highlander / Highlander Hybrid | 36.0% | Midsize SUV average was 47.0% |
| Tesla Model 3 | 54.6% | Lowest-depreciating EV in the study; EV average was 57.2% |
| Tesla Model Y | 57.8% | Above the EV average |
Two specific notes for this band.
Electric vehicles change the model rather than improving it. Lower running costs per mile, no oil service, but charging logistics become your problem, battery condition affects resale heavily, and tire wear is higher than most operators expect. In the iSeeCars study EVs lost 57.2% over five years, the worst of any segment. The economics can work well, especially on a car bought after that drop. They are not simply better.
Premium badges carry premium repair costs. A compact from a luxury brand books better than its mainstream equivalent and costs considerably more every time it needs anything. The same study found that electric vehicles and luxury models make up 24 of the 25 cars that lose the most value. Model the repair cost and the depreciation, not just the rate.
Source: iSeeCars 2026 study, segment and model tables, checked 16 October 2026.
Luxury and exotic: when the math works
It works in a narrow set of conditions and fails badly outside them.
It works when you are in a market with genuine demand for the category, when you have insurance that covers it at a price that does not consume the premium, when you screen guests seriously, and when you can absorb a long repair with the car off the road.
It fails when any one of those is missing. The failure mode is not gradual either. One significant incident on an exotic can exceed a year of profit from the rest of a small fleet.
The honest version: this is a different business with different risk, not an upgraded version of the same one. Operators who do it well treat it that way.
Cars to avoid, and why
Anything with poor parts availability. Unusual imports, discontinued models, anything where a common failure means a three-week wait. The repair cost is survivable. The downtime is not.
Vehicles approaching an expensive service interval. Check what is due at the mileage you will reach in year one. A timing belt or a major transmission service at 80,000 miles changes the whole calculation if you are buying at 70,000.
Cars with known expensive common faults. Easy to research, routinely skipped. Thirty minutes on owner forums for any model you are considering is the highest-return research you will do.
Very high mileage bargains. The purchase price is tempting and the depreciation is nearly zero, which looks excellent on paper. The downtime and repair frequency usually are not worth it, and a car in the shop earns nothing.
Anything you are buying because you want to drive it. The most expensive mistake in this business, and the most common one.
How to run the numbers on any car before you buy
A repeatable process, which matters more than any list of models because markets differ and so does your cost of capital.
- Find three to five comparable vehicles already listed in your metro. Note their daily rates and, where visible, how booked they appear.
- Take the lower end of those rates, not the top, and apply a conservative utilization estimate for your market.
- Subtract the platform fee at your earnings plan. The shares are in Turo fees explained.
- Subtract realistic running costs per rented day.
- Subtract the finance payment if applicable.
- Subtract annual depreciation divided by twelve. This is the step people skip.
- Compare the result against what the same capital would do elsewhere.
If the answer is thin, the answer is thin. Better to learn that on a spreadsheet than eighteen months into owning the car.
Mileage is part of step six. A generous distance limit adds miles, and miles add depreciation, which is why Turo mileage limits are worth setting per vehicle rather than leaving at the default.
The free earnings tool does steps three through six from your actual trip data once you are running, and from estimates before you are.
How to know which of your cars is actually earning
Everything above is about the car you are considering buying. The harder question is the one about the cars you already own, because the platform will never tell you.
Your dashboard shows gross revenue per vehicle. It does not subtract platform fees by earnings plan, maintenance, cleaning, unrecovered damage or depreciation. So the car at the top of your dashboard is frequently not the car at the top of your profit list, and most operators do not discover this until they sell one.
FleetSnap was built around that gap. Upload your trip export and it produces true profit per vehicle after fees, running costs and estimated depreciation, so you can see which cars to keep, which to sell, and which to buy more of. It is free for three reports a month at any fleet size, and a lot of operators use nothing else. How to read your fleet profit walks through the report.
The cars that make money are rarely the cars that book most. They are the cars that are cheap to run, quick to turn around, and rarely off the road.
Questions hosts ask
What is the best car for Turo for a beginner?
A three to six year old mainstream sedan or small crossover with good reliability and cheap parts. In iSeeCars' 2026 study, models like the Honda Civic, Toyota Corolla and Subaru Crosstrek lost well under the 41.8% average over five years. It will not have the most exciting listing and it is the most forgiving first vehicle.
Do luxury cars make more money on Turo?
They generate more gross revenue. Whether they make more profit depends on insurance cost, repair cost, downtime and your market's actual demand for the category. Frequently they do not, and luxury and electric models make up most of the fastest-depreciating cars in the iSeeCars study.
Are electric vehicles good for Turo?
They change the cost structure rather than straightforwardly improving it. Lower running costs and no oil service, but charging logistics, battery condition at resale and higher tire wear all cut the other way, and EVs lost 57.2% over five years in the iSeeCars 2026 study, the most of any segment.
How do I know if a car will be profitable before I buy it?
Model it: realistic rate, realistic utilization, platform fees, running costs, finance, and annual depreciation. If the result does not clear your threshold on paper, it will not in reality.
What is the biggest mistake when choosing a car for Turo?
Choosing by booking rate and ignoring depreciation, which is usually the single largest cost of owning the vehicle and the one that never appears on a platform dashboard.